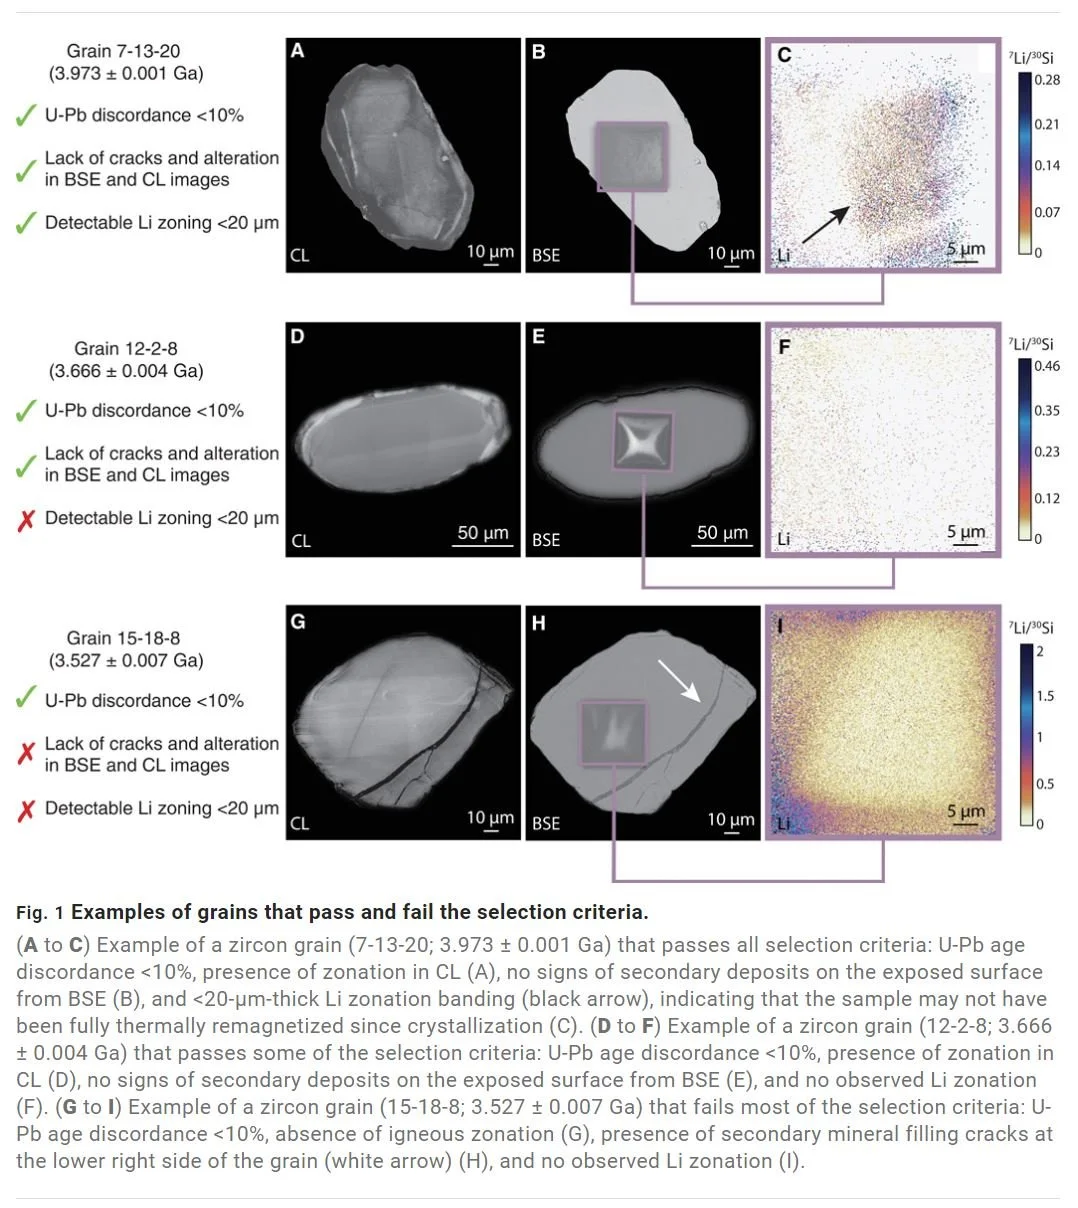
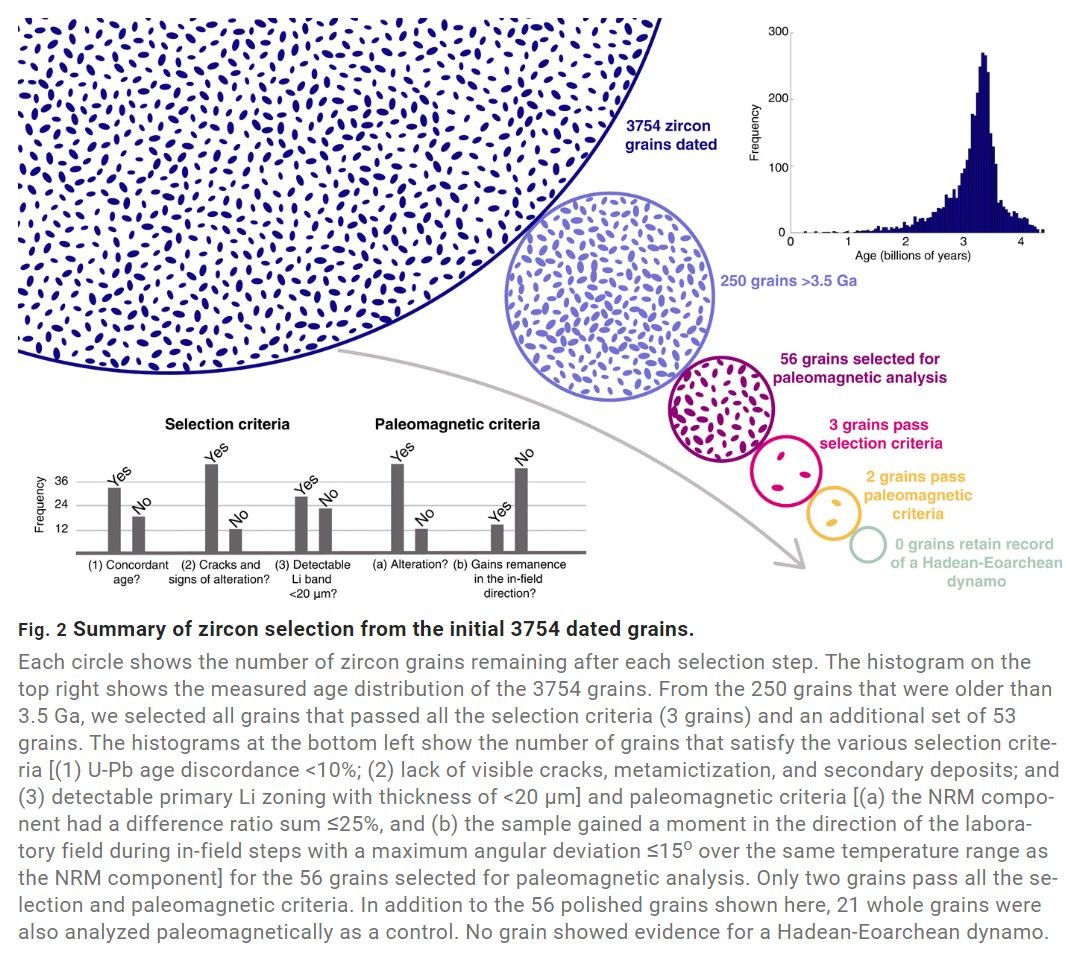
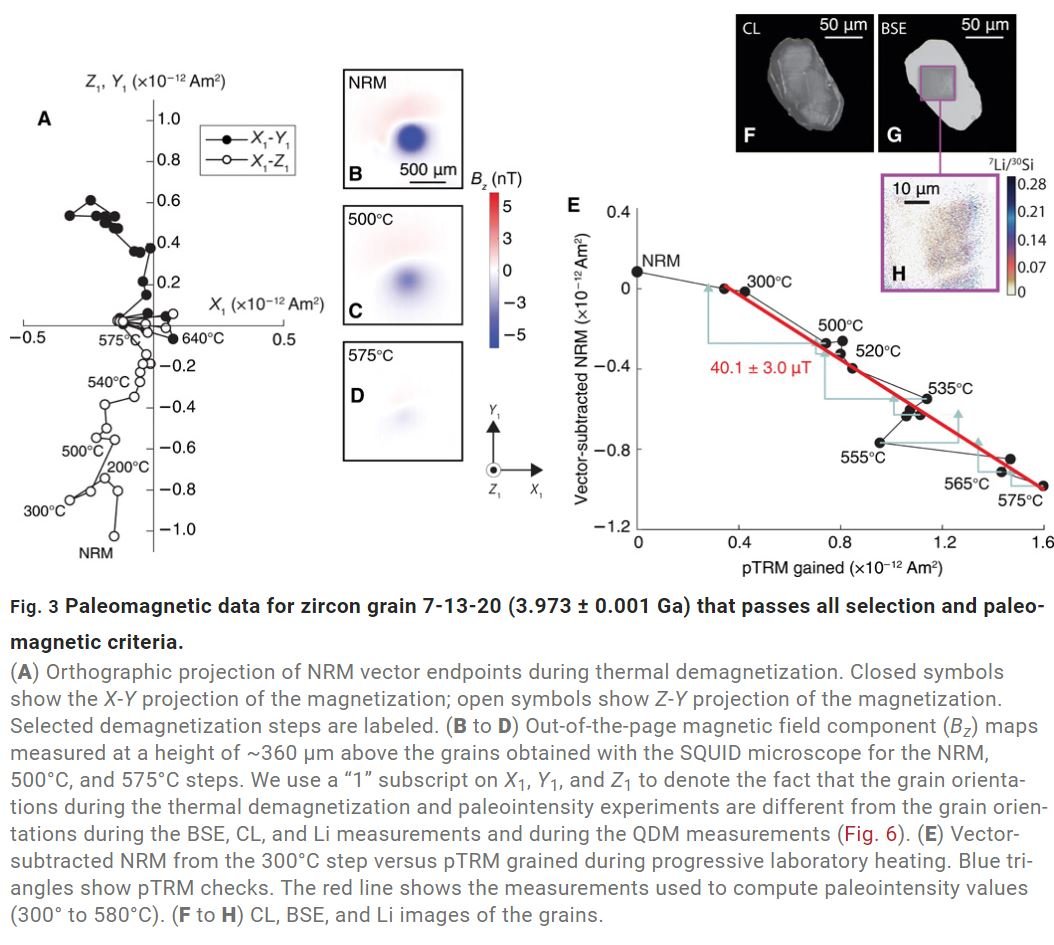
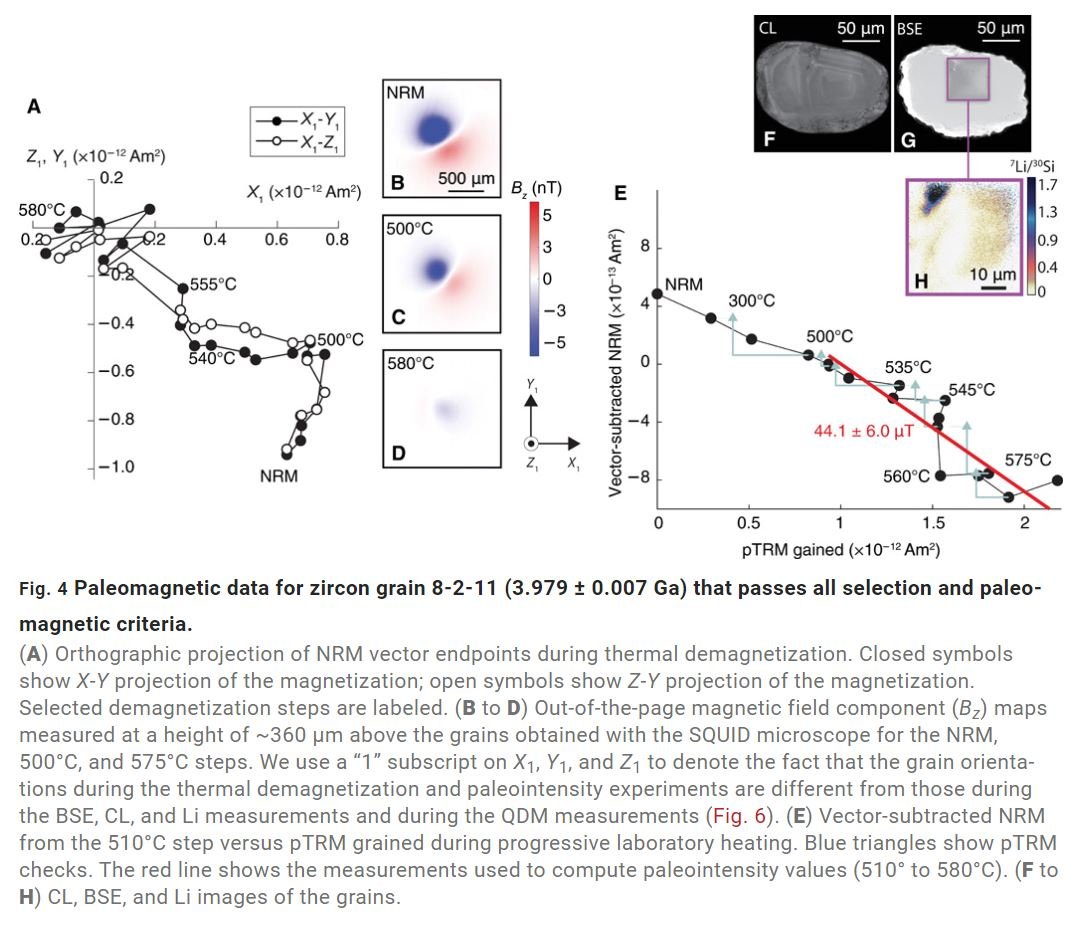


Geochemical evidence for thin syn-collision crust and major crustal thickening between 45 and 32 Ma at the southern margin of Tibet
Geochemical data on widely distributed igneous rocks of southern Tibet are used to reconstruct paleo-crustal thickness during the 50+ million years that have elapsed since the onset of the India-Asia collision. We use two approaches, one based on Nd isotopes and an assimilation-recharge model for granitic magma genesis and another empirical method based on trace element geochemistry (La/Yb). The focus is on granitic rocks of two age ranges in a segment of the southern Lhasa Block between approximately 89.5° and 92.5°E longitude. One age range, 45 to 62 Ma, spans the time of the onset of collision and for which we infer the geochemistry of granitic rocks reflects mainly pre-collision structure. The other age range is 21 to 9 Ma for the Nd isotopic approach, and 32 to 9 Ma for La/Yb, where the geochemistry must reflect post-collision structure. Our results suggest that the pre- and syn-collision southern margin of the Lhasa block, that portion now located within 50–60 km of the Indus-Yarlung suture (IYS) and south of 29.8°N latitude was relatively thin, about 25–35 km thick until 45 Ma. At approximately 29.8°-29.9°N latitude there was a pronounced crustal discontinuity, and north of that latitude (for a distance that we cannot constrain), the inferred crustal thickness was greater, at least 50–55 km, as indicated by latest Cretaceous and Early Tertiary granitoids and ignimbrites that have large fractions of assimilated continental crust and high La/Yb ratios. Post-collision Nd isotopic and La/Yb data from granitoids younger than 32 Ma suggest that the southern margin south of 29.8°N was thickened substantially to at least 55–60 km (based on Nd isotopes) and possibly as much as 70–75 km (based on La/Yb) by Early to mid-Miocene time. These observations require that thickening of the southern Lhasa Block margin in the period 45–32 Ma was non-uniform; the crust now within 60 km of the suture was thickened by approximately 40 km whereas the crust north of 29.9°N latitude was thickened much less, or not at all. The region currently between 29.8°N and the YTS may have been the highest elevation mountain terrane in the period from roughly 30 to 20 Ma. The amount of Miocene denudation reflects this difference, as there is evidence of substantially more denudation near the IYS than in the region north of 29.9°N. Some of the difference in thickening could be due to magmatic additions from the mantle in the region south of 29.8°N, but there is need for at least 30 km of tectonic thickening between 45 and 32 Ma. The non-uniform thickening suggests that the high elevations at the southern margin of the Himalaya-Tibet orogen propagated southward by about 200 km, from north of Lhasa to their present position, during the period from 50 to 20 Ma. Present crustal thickness requires an additional 10–15 km of more uniform post-Miocene thickening.

Geologic map of portion of southeast Tibet covering ~50,000 km2 from longitude 89.5 to 92.3 E and latitude 29 to 31 N, showing the distribution of calc-alkaline granitic (red-purple) and metasedimentary units (green) sampled in this study as well as other relevant geologic units (modified from 1:250,000 scale maps from China University of Geosciences Press Co., Ltd. including: Dangxiong District, H46C002001; Memba District, H46C002002; Lhasa District, H46C003001; Zedong District, H46C003002. Western portion, west of 90E, modified from Kidd et al., 1988. Further modification made from multiple field expeditions throughout the area by the authors and colleagues. Squares, circles and triangles indicate locations of samples (see table for references) used for Nd isotope analyses. Squares and circles show locations of peraluminous and metaluminous granites, respectively, and pre- or post-collisional crystallization age with grey fill indicating >48 Ma and white fill representing < 32 Ma. Grey triangles show locations of pre-collisional metasedimentary units sampled.

(a) Nd isotopic data from pre-45 Ma granitoids versus latitude. Also shown are the range of values for the Sangri (Sa), Yeba (Ye) and Linzizong (Lz) volcanic sequences. (b) Nd versus Sr isotope ratios. Crustal εNd values, estimated from metasedimentary samples and two-mica granites, are −10 south of 29.9°N and −12 north of that latitude.

(a) Nd isotopic data from post-32 Ma granitoids versus latitude. (b) Nd versus Sr isotope ratios showing inferred crustal values of εNd south of 29.9°N (−6) and north of that latitude (−8).

Nd isotopic values (εNd) of Cretaceous metasedimentary rocks and 30 Ma two-mica granites used to define the composition of the crustal component for the assimilation-recharge model. The εNd values are calculated to an age of 50 Ma. One sample with high εNd is a volcanogenic phyllite. The grey shaded zones are the values used for the crustal thickness estimates; the εNd values are inferred to be slightly different north and south of 29.9°N.

Crustal thickness estimates as related to Neodymium Crustal Index (NCI) and to chondrite-normalized La/Yb. (a) Relationship of thickness to NCI shown with approximate uncertainty estimate from a Monte Carlo approach where temperature is specified and all other parameters are allowed to vary within specified limits (details in appendix). (b) Crustal thickness as related to observed, aerially averaged La/YbN of granitoids with SiO2 between 54 and 68%. Subduction-related granites from Farner and Lee (2017) and collisional granites from Hu et al. (2017). The data in panel b include samples from Tibet, but those are younger than the granites discussed in this study.

Crustal thickness profile of southern Lhasa Block near the longitude of Lhasa inferred from Nd isotopes and assimilation-recharge model. (a) Profile (grey line) based on Nd isotopic compositions of pre-45 Ma granitoids. The letter “L” indicates the latitude of samples of sampled Linzizong volcanic rocks. (b) Thickness profile (black line) inferred from post-32 Ma granitoids.
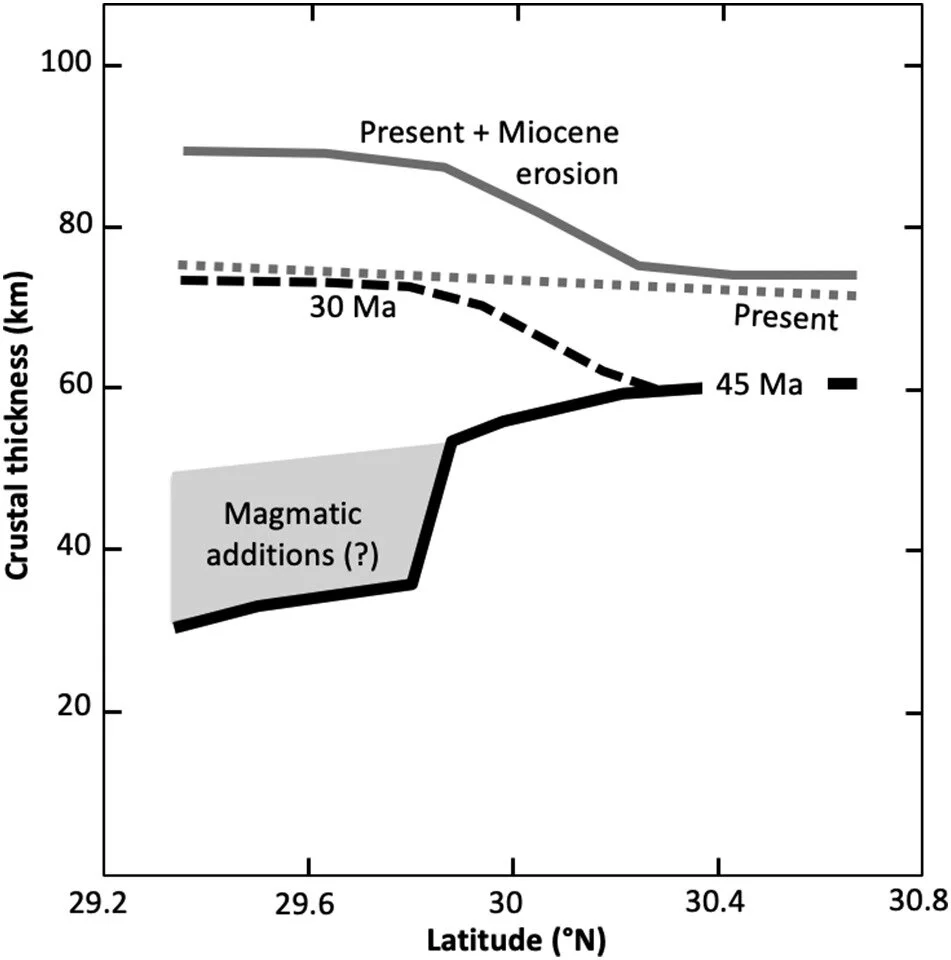
Summary diagram of inferred crustal thickness versus latitude at the longitude of Lhasa (about 91°E). The syn-collision southern margin of the Lhasa bock had a stepped thickness profile; thin at the southern margin and extending northward to what is currently 29.8°N. Between 29.8°N and 29.9°N the crustal thickness changed to 50–60 km, an inference based on granite Nd isotopes and La/Yb ratios, and consistent with paleo-elevation studies and the occurrence of widespread Eocene ignimbrites. Between 45 and 30 Ma the region between 29.3° and 29.9°N was dramatically thickened to roughly 70 km, but the region north of 30.2°N may not have been further thickened. Some of the thickening was from magmatic additions, but not most of it. The Miocene erosion profile is based on U,Th-He thermochronometry (Schmidt et al., 2019) and is consistent with the 30 Ma thickness profile shown. Subsequent to 20–30 Ma, there must have been additional uniform further thickening of 10–15 km to account for the present crustal thickness.
Structural evolution of central Death Valley, California, using new thermochronometry of the Badwater turtleback
The Badwater turtleback, Copper Canyon turtleback, and Mormon Point turtleback are three anomalously smooth, ∼2-km-high basement structures in the Black Mountains of Death Valley, California. Their structural evolution is linked to the Cenozoic tectonic history of the region. To explore their evolution, we apply (U-Th)/He, Ar/Ar, and U-Pb analyses, with multi-domain diffusion modeling to 10 samples from the Badwater turtleback. The cooling history of the Badwater turtleback is used as a proxy for its exhumation history as it uplifted from warmer depths. We find slow (<2 °C/m.y.) cooling from ca. 32 to 6 Ma, followed by rapid (120–140 °C/m.y.) cooling from ca. 6 to 4.5 Ma, and finally moderate (30–120 °C/m.y.) cooling occurred from ca. 4.5 Ma until the present. When these data are added to previously published cooling paths of the Copper Canyon turtleback and Mormon Point turtleback, a northwest cooling pattern is broadly evident, consistent with a top-to-NW removal of the hanging wall along a detachment fault. We propose a six-phase tectonic history. Post-orogenic collapse and erosion dominated from ca. 32 to 16 Ma. At 16–14 Ma, a detachment fault formed with a breakaway south and east of the Black Mountains, with normal faults in the hanging wall. Moderate extension continued from 14 to 8 Ma causing exhumation of the turtlebacks through the brittle-ductile transition. Dextral transtension at 7–6 Ma produced a pull-apart basin across the Black Mountains with rapid extension. The locus of deformation transferred to the Panamint and Owens Valley fault systems from 4.5 to 3.5 Ma, slowing extension in the Black Mountains until present.

Digital elevation model of Death Valley, California, region with geologic overlay after Miller and Pavlis (2005). Diagonal line indicates approximate direction of top-to-NW extension. BWT—Badwater turtleback, CCT—Copper Canyon turtleback, MPT—Mormon Point turtleback, DVFC—Death Valley–Furnace Creek, DVBM—Death Valley–Black Mountains, SHF—Sheep Head fault. The map projection is WGS84.

Digital elevation model of the Badwater turtleback (BWT) with geologic overlay after Miller and Pavlis (2005) with thermochronometric sample locations. Sample locations and elevations (this study) are shown along southern end of BWT. White circles are geochronological and thermochronometric age locations from this study, and white triangles are previously published thermochronometric age locations. Data from this study are projected onto line a–a′ and plotted in Figure 5. Zircon (U-Th)/He (zHe) and apatite (U-Th)/He (aHe) ages are from Bidgoli et al. (2015). Zircon fission track (zFT), biotite Ar/Ar (b), and muscovite Ar/Ar (m) ages are from Holm et al. (1992) and Holm and Dokka (1993). The map projection is WGS84. WSD—Willow Spring diorite; SMG—Smith Mountain granite.

Southern Badwater turtleback full data plot with a–a′ cross-section (Fig. 3). Geology after Miller and Pavlis (2005). Vertical thickness of plotted objects indicates error, which is exaggerated for some Ar/ Ar ages to make them more easily visible. Box at left shows zircon (U-Th)/He ages from southern Black Mountains from Bidgoli et al. (2015). See text for explanation of cooling ages. Full data tables are available in the Data Repository (see text footnote 1).
![Cooling envelopes for the Badwater turtleback (BWT; this study), Copper Canyon turtleback (CCT; Holm and Dokka, 1993), Mormon Point turtlebacks (MPT; Holm and Dokka [H&D], 1993), and crystallization ages (this study) of the adjacent Smith Mounta…](https://images.squarespace-cdn.com/content/v1/56327ad7e4b0733dcc08bab5/1573841096321-X8KLBJXQ60IHWDBSXH11/436f7.png)
Cooling envelopes for the Badwater turtleback (BWT; this study), Copper Canyon turtleback (CCT; Holm and Dokka, 1993), Mormon Point turtlebacks (MPT; Holm and Dokka [H&D], 1993), and crystallization ages (this study) of the adjacent Smith Mountain granite (SMG) and Willow Spring diorite (WSD) with intrusion depth estimates from Holm et al. (1992). The BWT cooling envelope is an outline of cooling ages, inclusive of error of closure temperature and measured age (this study; Fig. DR9 [see footnote 1]). Raw K-feldspar cooling ages were excluded (explanation in the Data Repository text). CCT and MPT envelopes are based on the uncertainty of cooling ages of Holm and Dokka (1993). Depth and exhumation rates on the Y-axis are based on a 30 °C/km geothermal gradient.

Schematic block diagrams of our evolutionary model for the Black Mountains in Death Valley, California. See text for supporting evidence of each depicted event. WSD—Willow Springs diorite; SMG—Smith Mountain granite.
From the Hadean to the Himalaya: 4.4 Ga of felsic terrestrial magmatism
Detrital zircons as old as nearly 4.4 Ga offer insights into the earliest moments of Earth history. Results of geochemical investigations of these grains have been interpreted to indicate their formation in near-H2O saturated meta- and peraluminous magmas under a relatively low (15–30 °C/km) geotherm. A key feature in pursuing a petrotectonic model that explains the full spectrum of these observations is their seeming contrast to most Phanerozoic magmatic zircons, specifically their low Ti-in-zircon crystallization temperatures and inclusion assemblages. The ~22 Ma Arunachal leucogranites of the eastern Himalaya appear, however, to be a rare exception to this generality. They show large-ion lithophile covariance trends indicative of wet basement melting together with a normal distribution of magmatic crystallization temperatures about an average of 660 °C. In the same fashion as Hadean zircons, Arunachal leucogranite and host gneiss zircons are dominated by muscovite + quartz inclusions that yield formation pressures of 5–15 kbars. We suggest that the Arunachal leucogranites originated in the hanging wall of a megathrust that carried H2O-rich foreland sediments to depths of >20 km whereupon de-watering reactions released fluids that fluxed hanging wall anatexis. Modeling suggests the thermal structure of this continental collision environment may have been broadly similar to a Hadean ocean-continent subduction zone. The similarity of these two environments, separated by over 4 Ga may explain seemingly common features of the Hadean and Arunachal leucogranite zircons. Their key difference is the absence of metaluminous magmas in the continental collision environment, which is shielded from juvenile additions.

Geologic map of the 92° E transect showing sample locations in the sills and dikes of the Arunachal leucogranites and their relationship to the Tsona leucogranites further north. Geology from Pan et al. (2004).
(a) Probability density function of <30 Ma 206Pb/238U zircon ages from the Arunachal leucogranite suite. (b) Probability density function of >30 Ma 207Pb/206Pb zircons from the Arunachal leucogranite suite. Note the different enlarged scale of relative probability of b compared to a.
Relative probability plot of zircon crystallization temperatures for Himalayan leucogranites from the 92°E transect in eastern Himalaya relative to the Hadean zircon population.
Electron micrograph of Arunachal zircon 0602010g2. Note the core/rim relationship with the younger rim exhibit the lower crystallization temperature and higher δ18O value compared with the older, higher temperature and isotopically lighter core. The muscovite inclusion exhibits a quasi-hexagonal crustal habit and coexists with feldspar. The elliptical feature in the feldspar marks the EMPA spot.
Rb/Sr vs. Sr plot (left) and Rb/Sr vs. Ba plot (right) for Himalayan leucogranites (in warm colors), the Arunachal leucogranites (black circles), averages for the Greater Himalayan Crystallines (open stars), the two host orthogniesses from this study (filled stars), and the field of GHC gneisses from the study of Vidal et al. (1982) in gray (one anomalously low Rb/Sr datum is omitted). Note that the covariance vector expected for muscovite vapor absent melting (musc VA) is parallel to the trend exhibited by all Himalayan leucogranites except Arunachal, which falls between that array and the trend for basement rocks but within the variance shown in gray. The fraction of melting used in the vector calculation is given by F.
Cross-section reconstruction of the eastern Himalaya along 92°E transect, ~200 km SW of the Siang window. This places Cretaceous-
Paleogene molasse mapped in the window structurally beneath the present day position of the Arunachal leucogranites. Modified from Yin et al. (2009).
Results of a thermo-kinematic simulation of the late Tertiary evolution of the Himalaya after 35 Ma of coupled underplating and surface exhumation. The black dots mark the position of the modeled Main Central thrust (MCT)—the boundary between oppositely verging units. The black arrows show the relative velocity field on either side of the MCT. The region outlined in white corresponds to the pressure-temperature range of 650 to 750 °C and 6 to 18 kbars documented in both Arunachal and Hadean zircons. Modified from Célérier et al. (2009).
dating terrestrial impacts with Zircon (uranium-thorium)/helium geochronology
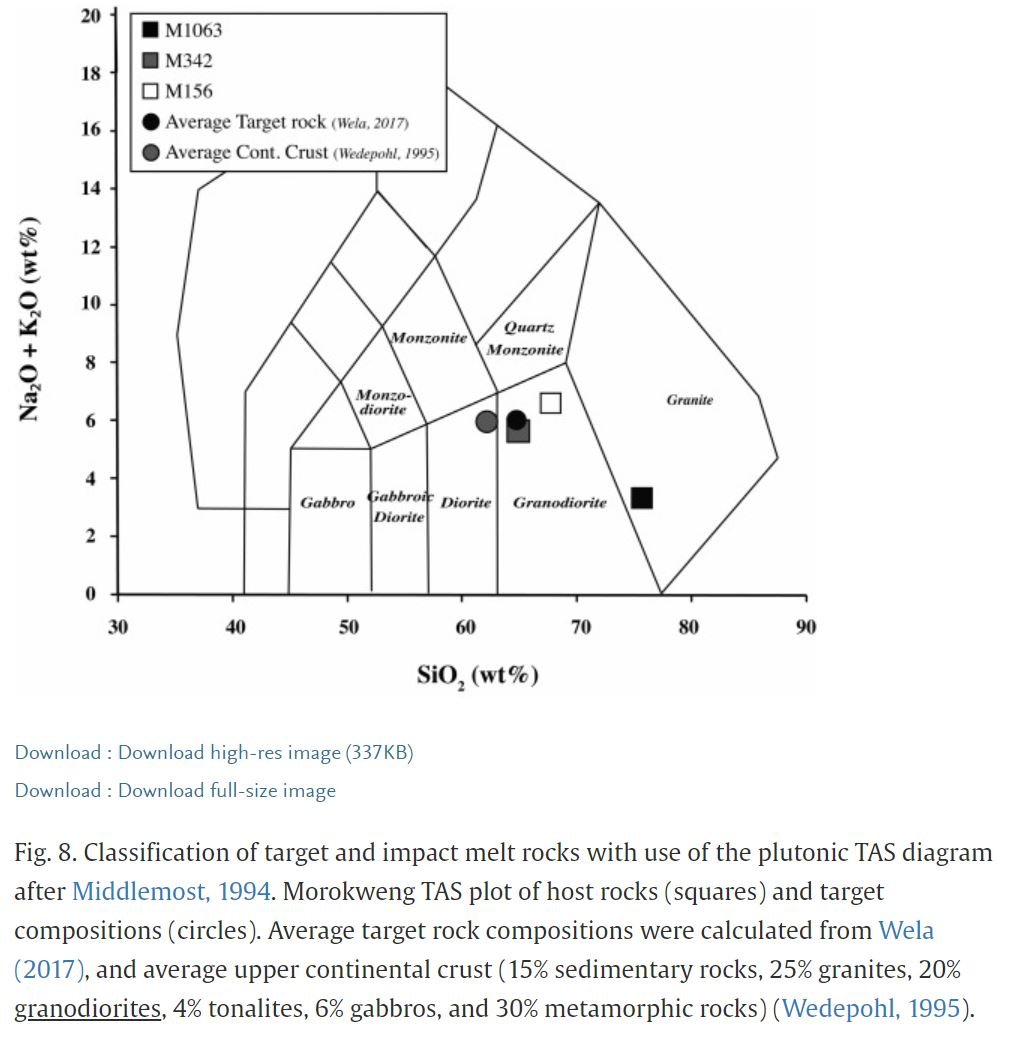
We investigate the presence of epitaxial overgrowth rims and 'reset' zircon, complete loss of radiogenic lead (Pb*), from terrestrial impactites to constrain the occurrence of such phenomenon in impact environments and their possible use in dating impact events. We also explore (U-Th)/He dating of zircon to evaluate this geochronometer in accurately identifying impact ages, particularly when no datable melt sheet exists. Our results show that (U-Th)/He ages of zircon from the brecciated, and presumably shocked target can accurately date an impact event and provides another tool to determine impact ages when no melt sheet exists, an alternative to problematic interpretations of commonly used apparent 40Ar/39Ar plateau ages. No evidence of epitaxial overgrowth rims and/or 'reset' zircon was observed, suggesting that zircons within shocked impactites have remarkably slow Pb diffusion and possibly explaining the relatively few 'reset' grains reported in terrestrial impactites.
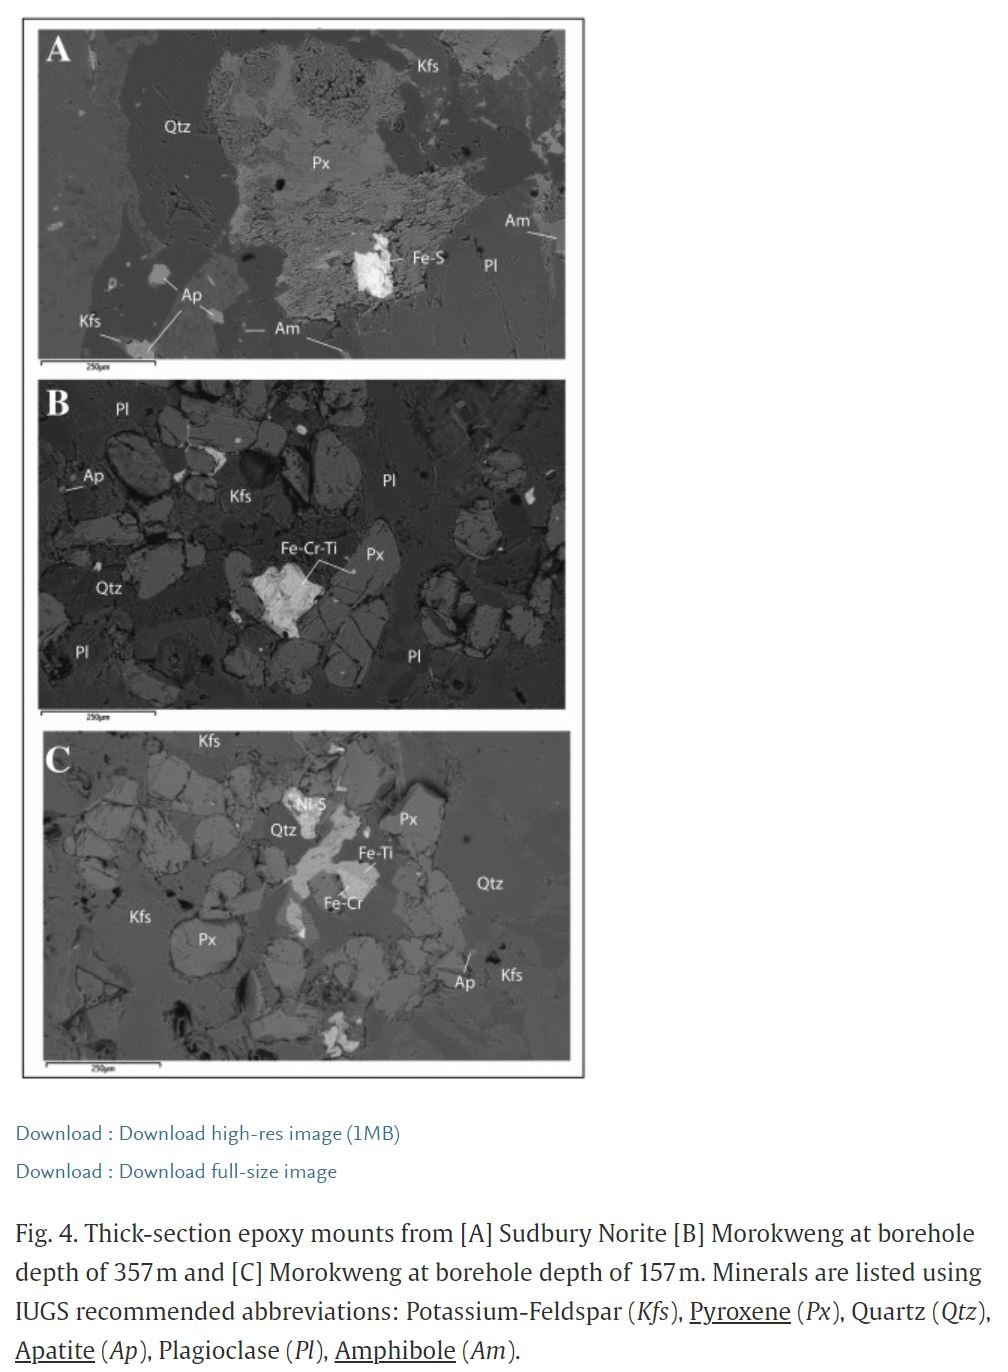
Back scattered electron images via LEO 1430 VP scanning electron microscope with measurements used for standard α-ejection corrections and morphometric analyses [Reiners, 2005]. Grains appear euhedral to subhedral for both Morokweng (A&B) and Vredefort (C&D) with some exterior fractures (D) but no evidence for impact shock features within zircon cores (see inlay in Figure 2 & 4) [Wittmann et al., 2006].
Log record of borehole M3, which includes the Morokweng meteorite, drilled into the center of the aeromagnetic anomaly at the impact structure, showing locations where zircons were extracted and analyzed. Inset are BSE images of grains from individual portions of the melt with their SIMS spot ages showing little disturbance of the target in U-Pb, Archean Pb-Pb ages, but complete resetting in (U-Th)/He age. Modified after Hart et al., (2002).
Concordia plot for zircons extracted from the main melt sheet (A) of the ~145 Ma Morokweng impact, from both the 155 and 400 m core splits [Wielicki et al., 2012], as well as a concordia plot for grains extracted from the Archean basement gneiss (B), from the 1069 m core split. Basement zircons show inherited Archean ages with some Pb*-loss, however errors on lower intercept are much too large to assign an accurate impact age. No evidence for grains 'reset' in U-Pb has been identified.
Depth profiles of Morokweng basement zircon to identify presence of epitaxial overgrowth rims coincident with the impact. No evidence of rims with Morokweng impact ages were observed on Archean target zircon cores. Insets are BSE and CL images of depth profiled grains showing oscillatory zoning and CL-active rims.
Zircon saturation in impact melts
We explore the formation conditions and inheritance probability of zircon in impact melts and the implications of using zircon geochronology to investigate planetary impact histories. Modeling the occurrence and crystallization temperature spectrum for zircon in simulated impact melts; we predict the presence of such grains within impactites and evaluate the use of these grains in dating impact events. We also report U-Pb geochronology of sieve-textured, possibly poikilitic, zircon identified in the pseudotachylite and granophyre units present within the largest known terrestrial impact crater (Vredefort, South Africa) to explore the accuracy of these grains in dating impact events at an impact structure of known age. Zircons with similar textures have been recently interpreted as growing in an impact melt in lunar meteorite SaU 169 (Gnos et al., 2004; Liu et al., 2012; Grange et al., 2013) and used to determine the age of the Imbrium impact. Modeling in simulated lunar impact melts predicts crystallization of zircon in merely ~2% of events, due to the high [Zr] needed to nucleate zircon in lunar melt compositions. Modeled crystallization temperature spectrum is significantly below Ti-in-zircon crystallization temperatures reported from lunar samples. Zircon formation within an impact melt is dictated by saturation of [Zr] and requires a high abundance for lunar melt compositions. This rules out the possibility of zircon growing in equilibrium with lunar meteorites. Poikilitic textures may be inherited from the lunar crust, presumably due to rapid decompression and/or resorption into an under-saturated magma, as previously recognized in plagioclase. Although either scenario could be due to an impact, endogenic processes cannot be ruled out and thus lunar zircons may not be recording impact melting events. SIMS U-Pb analysis of zircon with similar textures from Vredefort clearly shows that these grains are inherited from the Archean target rocks, with varying degrees of Pb-loss, and consequently cannot be used to identify the age of the Vredefort impact structure. Further understanding of the growth and isotopic effects on zircon associated with large impacts could form the basis of a tool to probe planetary impact histories.
Modeled crystallization temperature spectrum for zircons within simulated impact events on the lunar surface. Predicted zircon crystallization temperatures are significantly higher than reported Ti-in-zircon crystallization temperatures within lunar impact melts, suggesting that these grains did not form within lunar impact melts. Also shown are modeled results for impacts on an ancient terrestrial crust as compared to Hadean zircon from the Jack Hills, Western Australia and zircon grown in large terrestrial impact melts (Wielicki et al., 2011).

BSE images of in-situ VD_PB zircon (image A) and VD_G zircon (images B-F) compared to images of lunar meteorite SaU 169 (images G & H; Liu et al., 2012), highlighting similar poikilitic textures. See text for further description.
Concordia diagrams of zircon from the ~2 Ga Vredefort impact calibrated against AS3 zircon standard (Paces and Miller, 1993). (A) Grains analyzed in-situ within the melt matrix of VD_PB show these grains are inherited from the Archean basement and possibly record thermal effects associated with emplacement of the ~1 Ga Anna's Rust Sheet. (B) Grains isolated from the granophyre unit which exhibit poikilitic textures also show inheritance from the Archean target, with varying amounts of Pb-loss and a lower intercept presumably associated with the impact.
Geochemical signatures and magmatic stability of terrestrial impact produced zircon
Understanding the role of impacts on early Earth has major implications to near surface conditions, but the apparent lack of preserved terrestrial craters >2 Ga does not allow a direct sampling of such events. Ion microprobe U–Pb ages, REE abundances and Ti-in-zircon thermometry for impact produced zircon are reported here. These results from terrestrial impactites, ranging in age from ~35Ma to ~2 Ga, are compared with the detrital Hadean zircon population from Western Australia. Such comparisons may provide the only terrestrial constraints on the role of impacts during the Hadean and early Archean, a time predicted to have a high bolide flux. Ti-in-zircon thermometry indicates an average of 773 °C for impact-produced zircon, ~100 °C higher than the average for Hadean zircon crystals. The agreement between whole-rock based zircon saturation temperatures for impactites and Ti-in zircon thermometry (at aTiO2=1) implies that Ti-in-zircon thermometry record actual crystallization temperatures for impact melts. Zircon saturation modeling of Archean crustal rock compositions undergoing thermal excursions associated with the Late Heavy
Bombardment predicts equally high zircon crystallization temperatures. The lack of such thermal signatures in the Hadean zircon record implies that impacts were not a dominant mechanism of producing the preserved Hadean detrital zircon record.
Sample location for preserved terrestrial impactites. (A) Vredefort Impact, South Africa (after Gibson and Reimold, 2008) showing locations of pseudotachylite breccia and granophyre hand sample (VD_PB, VD_G) as well as drill core INL (VD_INL). (B) Map of Sudbury Impact, Canada and cross-section of the Sudbury Igneous Complex showing norite layer (Sud_F and Sud_M; after Zieg and Marsh, 2005). (C) Morokweng Impact, South Africa (after Jourdan et al., 2010) showing location and cross section of drill core M3 (MK_157 and MK_399). (D) Manicouagan Impact, Canada showing location of main melt sheet sample (MC_MM; after O'Connel-Cooper and Spray, 2011).
Concordia diagrams of zircon extracted from preserved terrestrial impactites calibrated against AS3 zircon standard (Paces and Miller, 1993). (A) Nearly all grains extracted from Vredefort are inherited from the target with exception of two grains from the INL borehole (denoted in red) which yield ages similar to the published impact age (~2020 Ma; 207Pb/206Pb TIMS zircon age; Kamo et al., 1996; Moser, 1997). (B) Zircon from the mafic norite of the Sudbury Igneous Complex yield ages in agreement with the published impact age (1849.5±0.2 Ma; 207Pb/206Pb TE-TIMS zircon age; Davis, 2008)with no signs of inheritance from the target rock. (C) Grains from the Morokweng borehole M3 yield ages similar to, however slightly older than, the published impact age (145±0.8 Ma; 207Pb/206Pb ID-TIMS zircon age, 40Ar/39Ar biotite age; Hart et al., 1997) with no sign of inheritance. (D) Zircon from the Manicouagan impact yield ages identical to those from previous studies (214±1 Ma; 207Pb/206Pb TIMS zircon age; Hodych and Dunning,
1992) and show no inheritance also. (E) No impact produced zircon has been extracted from the Popigai samples provided for this study with all grains reflecting target rock ages.
Titanium concentrations and Ti-in-zircon crystallization temperature, assuming αTiO2=1 (Watson and Harrison, 2005), of impact produced zircon. Saturation temperature underestimates crystallization temperature for differentiated impact melts (i.e. Sudbury and Morokweng; Watson and Harrison, 2005) (A) Sudbury impact produced zircon Tzir xtln=748±60 °C, bulk norite Tzir sat=650 °C (calculated from Lightfoot and Zotov, 2005). (B) Morokweng impact produced zircon Tzir xtln=797±70 °C, bulk melt sheet Tzir sat=730 °C (calculated from Andreoli et al., 1999). (C) Manicouagan impact produced zircon Tzir xtln=747±35 °C, bulk melt sheet Tzir sat=752 °C (calculated from Floran et al., 1978).
Trace element plots of impact produced zircon from Morokweng, Sudbury and Manicouagan to discriminate between continental and oceanic target rock compositions. All grains are corrected for uranium decay. Continental field from Grimes et al. (2007) with lower boundary denoted by a solid line on each diagram, indicating the upper most limit of unambiguously oceanic zircon. End points for lines: U vs. Yb (25, 1), (20,000, 10,000); U/Yb vs. Hf (5000, 0.05), (35,000, 5); U/Yb vs. Y (200, 0.01), (100,000, 5). Nearly all impact produced zircon suggest continental target lithologies however Manicouagan plots nearly in the oceanic field possibly due to a slightly more mafic target.
Probability density function for Ti-in-zircon crystallization temperatures of Hadean zircon from Western Australia (n=69; Harrison, 2009), mafic zircon (n=304; Fu et al., 2008), impact produced zircon (n=111; this study) and modeled impact produced zircon temperatures (n=80; this study). The significant temperature contrast between impact produced zircon, modeled impact produced zircon (on an Archean target composition) and that observed for Hadean zircon grains suggests that impacts were not a major contributor to the Hadean population.
GEOROC Archean database (n=10,058) plotted as M vs SiO2. Top axes are experimental results from Wyllie (1977) at 5 kbar, whereby the upper and lower axes represent liquidus temperatures at 5 wt.% H2O and water-undersaturated solidus temperatures, respectively. Wyllie (1977) dashed line is a fit ofMvs. SiO2 for melting experiments using felsic, intermediate and mafic compositions. This fit coincides with the regression of M vs. SiO2 for bulk composition of impactites from this study, which underscores the validity of using experimental melting relations to model impactite formation.
Experimental Calibration and development of sims technique for a Microscale White Mica Barometer
The Si per formula unit (Sipfu) content of potassic white mica varies according to the pressure dependent Tschermak substitution (Mg, Fe2+) + Si = Al[4] + Al[6], from ideal muscovite [K(Al2)Al(Si3010)(F,OH)2], through intermediate phengite compositions, to the theoretical Al-celadonite endmember [K(Mg, Fe2+)Al(Si4010)(F,OH)2]. The composition of white mica inclusions within Hadean
(>4 Ga) Jack Hills zircons, together with results from Ti-in-zircon thermometry, have been used to suggest their formation in a low heat flow environment, perhaps analogous to a modern-day convergent plate boundary. However, only a small fraction of such inclusions are large enough to analyze using EPMA and we are thus developing a SIMS analysis method capable of μm -scale measurements, relating Si/Al ion yields to Sipfu. We have experimentally produced neoformed, sub-μm micas and stabilized seeded mica under appropriate P-T conditions and are pursuing growth of ca. 1 μm crystals for SIMS analysis. Because Si and Al are the primary variants in the Tschermak substitution, the Si/Al ratio provides a potential proxy for Sipfu. Analysis of a large suite of potassic white micas (both experimental and natural samples) across a range of Sipfu from 2.7-3.7 using EPMA shows a high
degree of correlation with molar Si/Al. We then used these characterized standards to determine the relative ion yields (28Si+/27Al+) under SIMS O- bombardment to achieve quantitative Si/Al measurements of μm-sized unknowns. This approach has high sensitivity due to: the high abundance of Si and Al in muscovite, the high proportion of 28Si and 27Al relative to other isotopes (92% and 100%, respectively), and the relatively high useful yields of both Si+ and Al+ (0.7% and 2.7%, respectively).
Interferences on 27Al+ and 28Si+ by 26MgH+ and 27AlH+ respectively, can be separated at a mass resolving power of only ~3000 permitting high secondary ion transmission. The potential for a ~1 μm lateral resolution probe of Si/Al in white micas would permit most of the mica inclusion population found in Hadean zircons to be characterized and opens up the possibility of a routine method of thermobarometry in muscovite inclusion-bearing zircons of all ages.
SEM image of zircon RSES61_15.11 showing high-aspect-ratio muscovite inclusion interpreted to indicate trapping of a magmatic crystal during zircon growth. Positions of U–Pb and Ti analyses also shown [Hopkins et al., 2008, 2010].
P–T pseudo-section calculated for the Bullenbalong cordierite granite in the presence of q, pl and bio. Phase regions depicted with grey shading denote muscovite unstable with melt, whereas red colors show regions where muscovite and melt stably coexist. Darker shading indicates higher variance of phase assemblages. Selected contours of predicted Si content in muscovite (3.08–3.24, in moles per formula unit) are shown with light lines. Phase abbreviations: bi, biotite; mu, muscovite; sill, sillimanite; q, quartz; pl, plagioclase; liq, granitic melt; g, garnet; cd, cordierite; ksp, K feldspar [Hopkins et al., 2008, 2010].
Si/Al ratio under O- bombardment in SIMS of standards characterized for Sipfu by EPMA. Results suggest SIMS Si/Al ratio can be used as a good proxy for Sipfu and permits analysis of microscale unknowns and experimental products.
Origin and mixing timescale of Earth’s late venee
Experimental studies on the partitioning behavior of highly siderophile elements (HSE) between silicate and metallic melts imply that the Earth’s mantle should have been highly depleted in these elements by core formation in an early magma ocean. However, present HSE contents of the Earth’s mantle are ~3 orders of magnitude higher than that expected by experiments. The apparent over-abundance of HSE has commonly been explained by the addition of meteoritic material in the “late veneer” which describes the exogenous mass addition following the moon forming impact and concluding with the late heavy bombardment at ~3.8-3.9 Ga. The strongest evidence for this theory is that the platinum group element (PGE) contents in today’s mantle are present in chondritic relative abundances, as opposed to a fractionated pattern expected with metal-silicate partitioning.
Archean komatiites indicate that the PGE content of the Earth’s mantle increased from about half their present abundances at 3.5 Ga to their present abundances at 2.9 Ga. This secular increase in PGE content suggests a progressive mixing of the late veneer material into the Earth’s mantle. However, this time scale also implies that the whole mantle was relatively well mixed by 2.9 Ga.
We use a compilation of existing isotopic and trace element data in order to constrain the origin and composition of the late veneer. We use PGE abundances, W abundances and W isotopic compositions in chondritic meteorites and the primitive upper mantle to compute the amount of mass delivered during the late veneer and find the late veneer mass to be ~0.6 % the mass of the bulk silicate Earth (consistent with earlier estimates). We also use the 187Re-187Os and 190Pt-186Os systems to constrain the composition and timing of delivery of the impacting population.
We model the efficiency of mantle mixing in this time frame by using 3-dimensional numerical geodynamical simulations and geochemical constraints. Initial parameters include the amount of mass delivered in the late veneer and the Archean internal heating which is at least 4 times higher than the present values, due to the higher abundance of radioactive elements. Another important parameter is the mechanism of mass addition to the Earth. We test three end-member scenarios: (1) a single very large impactor accounting for the entire mass addition, (2) sprinkling of a large number of small impactors over the whole Earth which then mix into the mantle, or (3) by using a size/frequency distribution estimated from the lunar cratering record and corrected for the difference in gravitational cross section of the Earth and the Moon.
Pt versus age of komatiites. Data are normalized to 25% MgO. Data include those from Maier et al., (2009) and Barnes and Fiorentini (2008). EG, Eastern Goldfields superterrane (EG-G, Gindalbie terrane; EG-Ka, Kalgoorlie terrane; EG-Ku, Kurnalpi terrane). YN, Yilgarn North (Plutonic Marymia belt). Ka, Karelian terrane (Ka-Ko, Kostamuksha belt; Ka-Ku, Kuhmo belt; Ka-S, Sumozero-Kenozero belt). Y, Youanmi terrane (Y-M, Murchison domain; Y-Ss, Sandstone belt; Y-Rv, Ravensthorpe belt). RW, Ruth Well formation. SS, Sulphur Springs formation. WM, Weltevreden-Mendon formation. E, Euro basalt unit. A, Apex basalt unit. Ho, Hooggenoeg formation. Ko, Komati formation. Co, Coonterunah subgroup. Sa, Sandspruit formation. The inset toashows additional data for Proterozoic komatiites (Go, Gorgona island; R, Raglan belt; K, Karasjok belt; G, Gawler craton). Error bars represent one standard error of the mean for each belt, except for suites with fewer than five samples, in which error bars represent standard deviation. Also shown are four concepts of the late lunar bombardment. The “100 Ma half-life” is Neukum’s standard lunar crater curve for times after 3.86 Ga. It is calibrated to crater counts and surface ages from Apollo landing sites and the Imbrium impact basin (Neukum and Ivanov, 1994; Neukum et al., 2001). The steeper “50 Ma half-life” extrapolation uses the same data but it also uses the young 3.92 Ga age for the Nectaris impact basin and crater densities on still older but undated surfaces (after Wilhelms, 1987). The “single cataclysm” is a schematic but quantitatively representative late cataclysm as advocated by Graham Ryder (2002). “Multiple cataclysms” scatters several cataclysms over the Hadean (Tera et al. 1974). Figure adopted from Zahnle et al. (2007) and Maier et al. (2009).
Core formation should have quantitatively stripped highly siderophile elements from the mantle, but these elements are only depleted by a factor of ~170. Assuming the budget of these elements in the mantle comes from a late veneer similar to the average composition of chondrites, the mass of the late veneer is constrained to ~0.6% the mass of the bulk silicate Earth, or ~2.5×10²² kg. BSE composition is from Becker et al. (2006) and meteorite compositions from Horan et al. (2003).
Snapshots of 2D and 3D calculations showing the temporal tracer density distribution through the mantle, in the presence of a fully developed thermal convection for 2 specific examples. The thickness of the layer of impactor material represents 0.2 of mantle thickness, corresponding to 580 km. The internal heating is set at a non-dimensional value of 20.0. An extensive parametric study has been performed in 2D for several values of Rayleigh number and internal heating. Select cases will be further explored in 3D.
Evolution of the number of cells with zero impact material (tracers) with time for 2D (A) and 3D (B) simulations. The time has been scaled using the advection time: thickness of the mantle divided by the root-mean square velocity at each time timestep. Q and Ra are respectively the non-dimensional internal heating rate and the Rayleigh number, and V represents the calculations with temperature dependent viscosity.
(A) After the moon-forming impact and final stages of core formation the Earth’s mantle should have been significantly depleted in HSE at proportions equivalent to their respective distribution coefficients. Chondritic enrichment of HSE in the mantle is attributed to delivery via impacts in the 'late veneer' hypothesis. (B) Data from Maier et al. (2009) suggests that the early mantle was highly depleted in PGE relative to today with progressive increases until approximately 2.5 Ga, to present day values. These results suggest that PGE additions during a period of intense bombardment did not efficiently mix PGE back into the lower mantle suggesting the presence of an isolated stable surface reservoir (ISSR). (C) From >4 Ga the PGE contents of the mantle progressively increases until ~2.5 Ga to its present day value. Although the impact flux had dramatically decreased the PGE contents continue to rise, implying that at least some portion of the lithosphere, contaminated with chondritic PGE from impact ejecta and condensation of impact vapor plumes, remained stable and isolated from >4 Ga and was not completely mixed into the mantle for at least 1.5 Ga.